In this Checkpoint Software equity research sample, we will show the structure of a standard equity research report, the type of insight and information that can be found in equity research reports and the importance of flagging risk and items to follow up when performing investment research, to allow an effective revision process and question the validity of the investment thesis over time.
In this particular case, upon several revisions in conjunction with updated business results, Checkpoint Software was downgraded to hold from an initial buy rating assigned at the beginning of Gainshore’s coverage in 2021. Checkpoint Software stock has risen about 15% ever since, out beating most of the global cybersecurity stocks.
At Gainshore, we analyse thousands of companies, thoroughly screen the best ones and select only the best of the best stocks and ETFs, which we constantly monitor.
We tell you where to invest, and if we are wrong, you get the money back.
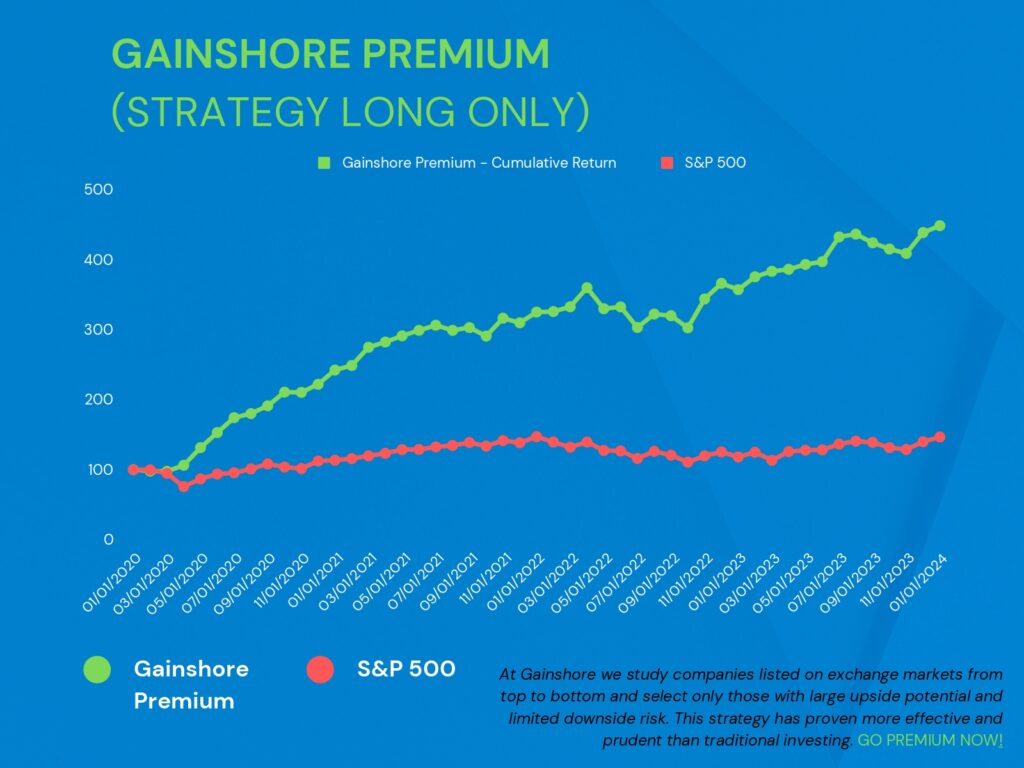
With our meticulous and stringent screening analytical process, Gainshore has achieved an extraordinary 100% winning rate on Long Term Stocks, and the Short Term Stocks have repeatedly been beating all global equity markets. Our stock recommendations have grown almost 250% since 2020 while exhibiting minimal negative volatility despite COVID-19, the Ukraine War and the current high inflationary environment.
Discover the Best Investments For 2023 now, or subscribe to our newsletter to learn more.
Table of Contents
CHECKPOINT SOFTWARE – COMPANY OVERVIEW
Established 29 years ago, Check Point Software Technologies is an American Israeli multinational provider of software and combined hardware and software products for IT security.
The firm provides protection against both known and unknown cyber security threats across a wide range of environments: physical and virtual networks, cloud and mobile surroundings, critical infrastructures, and the ‘Internet of Things’ (IoT). It leverages Nano Agent technology that is open-source and lightweight to ensure the latest security is delivered anywhere without the requirement of upgrades.
Check Point is presently focused on what it calls “fifth generation cyber security,” or “Gen V.” It identifies the fifth generation as focused on large-scale and fast-moving attacks across mobile, cloud, and on-premises networks that easily bypass the conventional, static detection-based defences being used by most organizations today.
CHKP had about 5500 employees at the end of 2022, of which approximately 30% were within research, development, and quality assurance functions. More than 70% of its workforce is based in Israel and the United States.
CHECKPOINT SOFTWARE – PRODUCTS / SERVICES
Check Point Infinity: a fully consolidated cyber security architecture that protects against 5th generations of cyber-attacks across all networks, endpoint, cloud, Workloads, IoT, and mobile:
1. Quantum: Enterprise network security for perimeter and data centre.
2. CloudGuard: Critical cloud workloads security
3. Harmony: Highest level of security for remote users and access
4. Infinity – Vision: Security Management


RECENT DEVELOPMENTS
CHKP blocked the recent highly malicious Log 4J malware even before it was known, protecting thousands of APIs and web servers.
2022 Revenues & EPS above original guidance.
Q4 2022 was the strongest quarter ever, not just financially but also by other internal metrics utilized as key performance indicators.
New message, new logo, brand, and products all under a revamped new strategy for 2022 and beyond, named CHECKPOINT ROCKETS.
CHECKPOINT SOFTWARE – REVENUE BY GEOGRAPHY
In Q4 2022, ~39% of revenue was derived from America, down from 45% in 2020 and 40% in 2021, 49% from Europe, the Middle East, and Africa, and 12% from Asia-Pacific, which remained stable.

CHECKPOINT SOFTWARE – INVESTMENT CASE
TECHNOLOGICAL LEADER
CHKP prides itself on being the best security provider.
The recently released Quantum Lightspeed firewall claims to be 10 times faster than its previous version, overtaking former first place FORTINET (FTNT) by 20% and becoming 20 times faster than PALO ALTO NETWORKS (PANW) and 25x faster than CISCO SYSTEMS (CSCO).
Recognized as a Major Player by top edge IT market research firms of the likes of IDC, Gartner, Frost & Sullivan, Miercom, Forrester, NSS Labs.
PROFITABLE
A consistently profitable company for over 15 years, with a history of reinvestment in core security technologies, threat research, new and enhanced products, system management, and sales channel.
CAPABILITY OF RENOVATING
New products have been released every year since 2019.
Constantly engaged in small-infant ventures that could likely become new industries, like the MDR (management-detection-response) or, as the CEO prefers to name it, MPR (management-prevention-response.)
We are pleased to note the increasing expense in Research & Development.
CUSTOMER BASE
About 14,000 customers and partners, including large multinationals and several Fortune 500 companies.
Highly positive customer feedback.
Active also in the consumer segment through its ZoneAlarm brand. In addition to threat intelligence gathered from millions of consumer endpoints, ZoneAlarm provides Check Point with an additional segment to test its core endpoint security technologies.
CEO APPROBATION AND EMPLOYEE SATISFACTION
3 decades experienced founder and CEO Gil Shwed seems competent, genuine, and confident. Shwed developed the idea while serving in the Unit 8200 of the Israel Defense Forces, where he worked on securing classified networks. He is considered the inventor of the modern firewall and authored several patents, such as the company’s Stateful Inspection technology. Shwed has received numerous accolades for his achievements and industry contributions. We have the feeling that Gil, other than capable, is honest, humble, and with a conservative tone, not keen on exaggerating results or selling ultra-optimistic financial projections.
Tal Payne, CFO and COO of the company seems competent; her straightforwardness and openness are something we greatly value.
Positive employee satisfaction.
BROAD AND INTEGRATED PRODUCT PORTFOLIO
A comprehensive and integrated portfolio of security products that it has assembled into mix-and-match suites and product sets.
Well positioned to engage with customers as they seek to reduce their vendor relationships while strengthening their security readiness.
Present within a limited subset of (MES) vendors with rollback remediation and hardware security integration features. Threat emulation and threat extraction are also distinctive MES product features.
STRENGTHS
Integration in one architecture is unique.
Considerable wide moat.
Unmatched scalability with the innovative product MAESTRO, introducing to the industry a new way to utilize current hardware investment and maximize appliance capacity in an easy-to-manage Hyperscale network security solution to bring networks and data centres to the world of hybrid clouds.
Prospect of cross-selling thanks to past strategic acquisitions yet centred on small niches that could potentially become new markets.
Global footprint.
CHKP claims to be the only vendor providing the widest security coverage and offering full protection from all attack vectors: mobile devices, networks, email, servers, endpoint devices, and the cloud.
The company claims to be superior because other direct competitors’ existing solutions fail to address the following key aspects:
Don’t focus on prevention,
Have a fragmented security stack,
Lack of integration and manageability.
CHECKPOINT SOFTWARE – FUNDAMENTAL ANALYSIS
TRACK RECORD, STEADY FINANCIALS
Checkpoint Software has a history of being a conservative cybersecurity company content with buying back stock and delivering slow revenue growth instead of going aggressively after the end-market opportunity.
Revenue and earnings per share have been steadily growing year every year, all key financial ratios show very little volatility; something not many competitors can be proud of.
Actual results have usually been very close to forecasts.
Long-term goal of double-digit growth, already in traction by looking at the speed of new billings.
PROFITABILITY
With operating and net margins at ~43% and ~40%, respectively, CHKP is the most profitable company among its competitors. For instance, from the same hypothetical level of revenue, CHKP generates 3 times the earnings of Fortinet due to a higher gross margin (+1000 pts) and lower operating expenses (-1200 pts).
Its relatively higher gross margin (~85%+ vs 75%+), arising from lower variable costs, provides more operating leverage and further upside shall demand grow at a faster pace in the future.
CHKP has been consistently earning 20%+ on invested capital, which we deem very satisfactory.
HEALTHY BALANCE SHEET
Low levels of financial leverage and debt-to-equity ratio compared to peers.
Intangibles account for about 20% of total assets, in our view, a physiological ratio for the industry. Goodwill increased after the latest 2 acquisitions (see more information below), and we would like it to remain at its current levels.
CASH CONVERSION
Conversion ratios are impressively high, indicating that cash is received before translating into revenue, resulting in cash-positive changes in working capital year after year.
CASH IN HAND
Plenty of cash sits in the bank account. At the end of 2020, CHKP held ca. 28% of its assets in (short-term investment grade) marketable securities, roughly 13$ per share; if CHKP used all its cash available to repurchase shares at today’s stock value, its 2021 earnings per share would automatically rise some 13.5% to ca. 6.9$.
Being cash-rich is usually great news for companies as fresh money could be used for a number of reasons, including repaying debt, cash repurchases, dividends, cushion in case of slowdown, or unexpected expenses. However, lots of cash may also tempt management to enter into acquisitions that, in the long term, dilute or, even worse, destroy shareholders’ value. Holding too much cash could also show poor liquidity management or a lack of potential core opportunities to be exploited.
CHECKPOINT SOFTWARE – VALUATION

While we will closely watch any potential development of CHKP and its main competitors, CHKP’s stock price below $150 represents an undervaluation.
The stock trades below its fair value, and the reason lies behind the company’s revenue growth, which has been single-digit (5-7%) versus some of its competitors’ double-digit growth (20%+, see Fortinet, Palo Alto, Cloudflare) experienced for as much as 5 years in a row. We already mentioned it is most important to give more emphasis on actual profits rather than gross sales, and there are at least 2 more points to consider:
- The very same stocks Wall Street foresees very high growth for already show some sign of slowdown or deterioration of key financial ratios; these stocks also show high levels of financial leverage employed to fuel growth.
- Even if these same stocks were to grow their earnings by 20-25% per year for another 5 years, their valuation still looks expensive, as we write.
CHECKPOINT SOFTWARE – INTRINSIC VALUE
We employed 2 different approaches in order to get the most accurate and unbiased estimate of Checkpoint’s fair value.
1. a multi-stage discounted cash flow analysis based on the following assumptions:
- 3-year average Owner Earnings per share [2] of $5.9
- Projected growth of 4% per annum for the first 5 years and 3% from the 6th year onwards
- Discount rate of 7% [3].
2. a more sophisticated attempt to model forward-looking projections (SEE APPENDIX) of the company’s profit & loss, balance sheet, and cash flow for the upcoming 5 years to look at things from a more detailed angle and to incorporate conservative, if not pessimistic, assumptions based on the shortfalls emerged from recent trends and latest earnings results, such as:
– revenue growth in the low to mid-single digits: 4.5% CAGR
– declining operating margin, from 40% to 31.2%, due to an increase in operating expenses; persisting margin pressure is due to heavy investments to increase headcount and, to a lower extent, to a higher cost of sales mainly comprised of costs related to hardware materials.
– increase in earnings per share from $6.8 to $7.6 driven by repurchases of about 4.5 million shares per year at an average price of $130, taking into account the real possible cost of stock options issued for personnel share-based compensation.
Both our approaches lead to an approximate intrinsic value of about $150.
3. Using the $150 estimated fair value for Checkpoint Software as the most probable scenario, we went further to seek more assurance by forecasting two more possible scenarios.
As outlined earlier, we envisage several catalysts that could drive the company’s earnings up substantially in the near future; likewise, there is a possibility that the company could lose traction as customers shift to competitors or the entire sector is shaken by innovative changes that will revolutionize the IT world and reduce the need for cybersecurity (for instance, no-code programming.)
For the best-case scenario, we used the latest free cash flow per share ($7.5) and a growth of 7% p.a. for the first five years, declining 1% every five years to remain at 3% in year 20 and beyond.
For the worst-case scenario, we simulated a drop in earnings per share to the 10-year average ($4.5) and a cumulative 0.5% yearly decline for 20 consecutive years.
We trust there is much more upside for Check Point Software and the digital security market. Therefore we assigned 20% probability to the best-case, 10% to the worst-case, and 70% to the current scenario.
| SCENARIO | INTRINSIC VALUE | PROBABILITY |
| CURRENT | ~$150 | 70% |
| BEST-CASE | ~$300 | 20% |
| WORST-CASE | ~$40 | 10% |
An expected average intrinsic value of about $165 was obtained, supporting our $150 estimate.
CHECKPOINT SOFTWARE – RELATIVE VALUATION [4]
As much as we like the industry, we deem most of its stocks currently overvalued.
The group of peer cybersecurity companies that we selected comprehends small and large capitalization stocks.
The peer group is characterized by a few players holding between 15% and 25% market share, with most of the others generating from 1% to 5% of total group revenue. Checkpoint Software sits at 5th place with a 12% market share constantly held yearly over the last 10 years.
Despite the positive trend, about one-fourth of the group is still loss generating whilst some well-known key players show tiny net margins usually because of high sales and general and administrative expenses.
To learn more about the status of the cybersecurity industry, read our full article: Are Cybersecurity stocks still seductive in 2023?
For comparison purposes only, we show that by applying the average of Price-Earnings and Enterprise Value/ EBITDA of our peer group as multiples, the relative value of Check Point Software appears to be approximately 2 times the current price.
| STOCK | P/E | EV/EBITDA |
| PALO ALTO NETWORKS | N/A | N/A |
| MANDIANT | N/A | N/A |
| VARONIS SYSTEMS | N/A | N/A |
| CLOUDFLARE | N/A | N/A |
| ABSOLUTE SOFTWARE | 157.8 | 89.0 |
| RADWARE | 99.7 | 47.0 |
| FORTINET | 84.6 | 68.5 |
| QUALYS | 71.2 | 38.0 |
| F5 | 37.2 | 23.6 |
| AVAST | 30.8 | 13.8 |
| CHECK POINT SOFTWARE | 20.7 | 16.1 |
| NortonLifeLock | 18.1 | 12.2 |
| A10 NETWORKS | 11.8 | 20.0 |
| AVERAGE | 59.1 | 36.5 |
| RELATIVE VALUATION | ||
| P/E | EV/EBITDA | |
| CHECK POINT SOFTWARE | $240 | $267 |
CHECKPOINT SOFTWARE – RISKS AND ITEMS TO FOLLOW UP
EPS VS NET INCOME. EPS trends higher while net income in absolute numbers trends lower. Share repurchases – which have been the main cause for higher trending earnings per share – may diminish or halt in the future, triggering a potential EPS downtrend and, ultimately, a stock price reduction.
REVENUE AND EARNINGS STABILITY. Results have such low volatility that it seems too good to be true.
NEGATIVE IMPACT OF INFLATION. During ‘Q4 2021 earnings release CHKP confirmed that its products’ prices increase (+7%), taking effect from January 1st 2022, is lower than cost increases experienced in 2021. We will follow up on this matter by watching closely to gauge whether the company is fully capable of passing inflation costs to customers.
WEAK MARKET PENETRATION IN THE UNITED STATES. We had drawn our attention to how the company would perform in the United States since, in Q3 ’21, an organizational restructuring for the US was announced, particularly with regard to the sales force, with Geoff Waters joining as Geo Sales for Americas at the beginning of Q2 2021. Q4 results show a decline in revenue contribution from the US, while more customers or larger tickets were obtained in Europe, the Middle East, and Africa. We argue this as a possible red flag, but we are also inclined to think that some of this could be natural as most of the competition is US-based firms and expanding its footprints elsewhere might work quite fine for CHKP as it possibly grows towards more profitable and stable markets.
FEW INFO ON CUSTOMERS’ CONTRACTS. We remain eager to extrapolate useful information on this front.
DEFERRED REVENUE. We do not like the increase of this liability item in the 31/12/2022 balance sheet and the concurrent lengthening of the company’s cash conversion cycle.
VALUE CHAIN RISKS AND BOTTLENECKS.
RECENT ACQUISITIONS
February 2022 – Spectral: acquired for $60m, it is a cloud security developer of a scanner that identifies errors in code developments, hence in the earlier stages in the software development cycle.
August 2021- Avanan. With about 5,000 customers, Avanan was recognized as one of the Fastest-Growing Email Security Companies in North America on the 2021 Deloitte Technology Fast 500. With this move, CHKP aims to strengthen its positioning in the Cloud Email Security market, whose size was estimated at $800M in 2021 and is expected to grow 150% to $2B by 2025. The cost of acquisition was between $250 and 300$ million.
September 2020 – Odo Security Ltd-: a developer of a new cloud-based technology that delivers secure remote access. The technology was integrated with Check Point’s Infinity architecture threat prevention capabilities to provide a secure solution to address the growing needs that enterprises have to enable secure remote access for their employees to any application.
[1] Performance since recommendation date.
[2] Earnings – Depreciation & Amortization + Capex.
[3] We did not derive the company’s cost of equity and WACC from traditional CAPM but instead used proprietary techniques based on the company’s specific risks.
[4] As at 08/02/2022
APPENDIX
CHECKPOINT SOFTWARE – PROJECTIONS – STATEMENT OF CASH FLOW
| 2021-12 | 2022-12 | 2023-12 | 2024-12 | 2025-12 | 2026-12 | ||
| Net income | 816 | 881 | 877 | 869 | 858 | 841 | |
| Depreciation & amortization | 31 | 14 | 14 | 14 | 14 | 14 | |
| Amortization of debt discount/premium and issuance costs | 21 | 15 | 15 | 15 | 15 | 15 | |
| Investments losses (gains) | -1 | -1 | -1 | -1 | -1 | -1 | |
| Deferred income taxes | -4 | 11 | 11 | 11 | 11 | 11 | |
| Stock based compensation | 120 | 129 | 140 | 150 | 162 | 162 | |
| Change in working capital | 216 | 235 | 219 | 212 | 269 | 264 | |
| Accounts receivable | -52 | -13 | -28 | -56 | -30 | -61 | |
| Prepaid expenses | 1 | 8 | -3 | -6 | -4 | -7 | |
| Accounts payable | -8 | 12 | -2 | -2 | -2 | -2 | |
| Income taxes payable | 66 | 0 | 0 | 0 | 0 | 0 | |
| Other working capital | 208 | 229 | 252 | 277 | 305 | 335 | |
| Other non-cash items | 6 | 0 | 0 | 0 | 0 | 0 | |
| Net cash provided by operating activities | 1204 | 1282 | 1273 | 1271 | 1328 | 1307 | |
| Cash Flows From Investing Activities | |||||||
| Investments in property, plant, and equipment | -16 | -22 | -22 | -22 | -22 | -22 | |
| Acquisitions, net | -220 | -109 | -109 | -109 | -109 | -109 | |
| Purchases of investments | -1790 | -1993 | -1993 | -1993 | -1993 | -1993 | |
| Sales/Maturities of investments | 1950 | 1965 | 1965 | 1965 | 1965 | 1965 | |
| Net cash used for investing activities | -75 | -159 | -159 | -159 | -159 | -159 | |
| Cash Flows From Financing Activities | |||||||
| Common stock repurchased | -1306 | – 1,383 | – 1,465 | – 1,250 | – 1,150 | – 1,290 | |
| Other financing activities | 194 | 189 | 189 | 189 | 189 | 189 | |
| Net cash provided by (used for) financing activities | -1112 | -1194 | -1276 | -1061 | -961 | -1101 | |
| Net change in cash | 16 | -71 | -161 | 51 | 208 | 47 | |
| Cash at beginning of period | 256 | 272 | 201 | 40 | 91 | 299 | |
| Cash at end of period | 272 | 201 | 40 | 91 | 299 | 346 | |
| Free Cash Flow | |||||||
| Operating cash flow | 1204 | 1282 | 1273 | 1271 | 1328 | 1307 | |
| Capital expenditure | -16 | -22 | -22 | -22 | -22 | -22 | |
| Free cash flow | 1188 | 1260 | 1252 | 1249 | 1306 | 1285 |
CHECKPOINT SOFTWARE – PROJECTIONS – BALANCE SHEET
| 2021-12 | 2022-12 | 2023-12 | 2024-12 | 2025-12 | 2026-12 | |||
| Cash and cash equivalents | 272 | 201 | 40 | 91 | 299 | 346 | ||
| Short-term investments | 1422 | 1450 | 1478 | 1506 | 1533 | 1561 | ||
| Total cash | 1694 | 1651 | 1517 | 1294 | 1036 | 660 | ||
| Receivables | 598 | 611 | 639 | 668 | 698 | 729 | ||
| Prepaid expenses | 46 | 38 | 41 | 44 | 48 | 52 | ||
| Total current assets | 2338 | 2300 | 2197 | 2006 | 1782 | 1441 | ||
| Non-current assets | ||||||||
| Property, plant and equipment | ||||||||
| Gross property, plant and equipment | 181 | 203 | 225 | 247 | 268 | 290 | ||
| Accumulated Depreciation | -98 | -112 | -125 | -139 | -153 | -166 | ||
| Net property, plant and equipment | 83 | 91 | 99 | 108 | 116 | 124 | ||
| Equity and other investments | 2090 | 2090 | 2090 | 2090 | 2090 | 2090 | ||
| Goodwill | 1196 | 1305 | 1414 | 1523 | 1632 | 1632 | ||
| Intangible assets | 61 | 61 | 61 | 61 | 61 | 61 | ||
| Deferred income taxes | 52 | 63 | 73 | 84 | 95 | 105 | ||
| Other long-term assets | 80 | 80 | 80 | 80 | 80 | 80 | ||
| Total non-current assets | 3562 | 3690 | 3818 | 3946 | 4073 | 4092 | ||
| Total assets | 5900 | 5990 | 6015 | 5952 | 5855 | 5533 | ||
| Accounts payable | 10 | 22 | 23 | 25 | 27 | 29 | ||
| Taxes payable | 28 | 28 | 28 | 28 | 28 | 28 | ||
| Accrued liabilities | 407 | 407 | 407 | 407 | 407 | 407 | ||
| Deferred revenues | 1257 | 1,406 | 1,569 | 1,749 | 1,947 | 2,165 | ||
| Other current liabilities | 10 | 10 | 10 | 10 | 10 | 10 | ||
| Total current liabilities | 1712 | 1872 | 2038 | 2219 | 2419 | 2639 | ||
| Deferred revenues | 450 | 530 | 618 | 715 | 822 | 939 | ||
| Other long-term liabilities | 481 | 481 | 481 | 481 | 481 | 481 | ||
| Total non-current liabilities | 931 | 1011 | 1099 | 1196 | 1303 | 1420 | ||
| Total liabilities | 2643 | 2883 | 3137 | 3416 | 3722 | 4059 | ||
| Common stock | 1 | 1 | 1 | 1 | 1 | 1 | ||
| Additional paid-in capital | 2277 | 2595 | 2924 | 3263 | 3615 | 3966 | ||
| Retained earnings | 11531 | 12412 | 13289 | 14158 | 15016 | 15857 | ||
| Treasury stock | -10551 | -11934 | -13400 | -14650 | -15800 | -17090 | ||
| Accumulated other comprehensive income | -1 | -1 | -1 | -1 | -1 | -1 | ||
| Total stockholders’ equity | 3257 | 3073 | 2813 | 2772 | 2831 | 2733 | ||
| Total liabilities and stockholders’ equity | 5900 | 5956 | 5950 | 6187 | 6553 | 6792 |
CHECKPOINT SOFTWARE – PROJECTIONS – PROFIT & LOSS
| 2021-12 | 2022-12 | 2023-12 | 2024-12 | 2025-12 | 2026-12 | ||
| Revenue | 2167 | 2,265 | 2,366 | 2,473 | 2,584 | 2,700 | |
| Cost of revenue | 258 | 277 | 298 | 321 | 345 | 370 | |
| Gross profit | 1909 | 1,987 | 2,068 | 2,152 | 2,240 | 2,330 | |
| Operating expenses | |||||||
| Research and development | 293 | 324 | 358 | 396 | 437 | 484 | |
| Sales, General and administrative | 708 | 757 | 809 | 865 | 925 | 988 | |
| Total operating expenses | 1001 | 1,081 | 1,167 | 1,261 | 1,362 | 1,472 | |
| Operating income | 908 | 906 | 901 | 892 | 878 | 858 | |
| Other income (expense) | 42 | 43 | 45 | 46 | 47 | 49 | |
| Income before taxes | 950 | 950 | 946 | 938 | 925 | 907 | |
| Provision for income taxes | 134 | 69 | 69 | 68 | 67 | 66 | |
| Net income from continuing operations | 816 | 881 | 877 | 869 | 858 | 841 | |
| Net income | 816 | 881 | 877 | 869 | 858 | 841 | |
| Net income available to common shareholders | 816 | 881 | 877 | 869 | 858 | 841 | |
| Earnings per share | |||||||
| Diluted | 6.08 | 6.84 | 7.14 | 7.33 | 7.44 | 7.60 |
CHECKPOINT SOFTWARE – PROJECTIONS – KEY RATIOS
| 2021-12 | avg g | 2022 E | 2023 E | 2024 E | 2025 E | 2026 E | ||
| Revenue USD Mil | 2167 | 5.63% | 2,265 | 2,366 | 2,473 | 2,584 | 2,700 | |
| Gross Margin % | 88.1 | -0.70% | 87.8 | 87.4 | 87.0 | 86.7 | 86.3 | |
| Operating Income USD Mil | 908 | 1.08% | 906 | 901 | 892 | 878 | 858 | |
| Operating Margin % | 41.9 | -4.37% | 40.0 | 38.1 | 36.1 | 34.0 | 31.8 | |
| Net Income USD Mil | 816 | -0.64% | 881 | 877 | 869 | 858 | 841 | |
| Earnings Per Share USD | 6.08 | 7.52% | 6.8 | 7.1 | 7.3 | 7.4 | 7.6 | |
| Shares Mil | 134 | -7.75% | 129 | 123 | 119 | 115 | 111 | |
| Book Value Per Share * USD | 25.57 | 3.29% | 23.9 | 22.9 | 23.4 | 24.6 | 24.7 | |
| Operating Cash Flow USD Mil | 1204 | 4.69% | 1,282 | 1,282 | 1,282 | 1,282 | 1,282 | |
| Cap Spending USD Mil | -16 | -21.44% | – 22 | – 22 | – 22 | – 22 | – 22 | |
| Free Cash Flow USD Mil | 1188 | 5.25% | 1,250 | 1,202 | 1,135 | 1,185 | 1,138 | |
| Free Cash Flow Per Share * USD | 8.75 | 14.34% | 10.0 | 11.4 | 13.1 | 15.0 | 17.1 | |
| Working Capital USD Mil | 625 | -11.37% | 428 | 160 | – 213 | – 638 | – 1,199 | |
| Net Margin | 37.7% | 38.9% | 37.1% | 35.2% | 33.2% | 31.1% | ||
| Asset Turnover | 0.37 | 0.38 | 0.39 | 0.42 | 0.45 | 0.50 | ||
| Return on Assets % | 13.83% | 14.70% | 14.58% | 14.88% | 14.93% | 15.50% | ||
| Financial Leverage (Average) | 1.81 | 1.95 | 2.14 | 2.11 | 2.03 | 1.98 | ||
| Return on Equity % | 25.1% | 28.7% | 31.2% | 31.4% | 30.3% | 30.8% | ||
| Return on Invested Capital % | 21.8% | 24.8% | 26.6% | 26.7% | 25.9% | 26.2% | ||
| Current Ratio | 1.37 | 1.23 | 1.08 | 0.90 | 0.74 | 0.55 | ||
| Quick Ratio | 1.34 | 1.21 | 1.06 | 0.88 | 0.72 | 0.53 | ||
| Days Sales Outstanding | 99.34 | 97.20 | 97.20 | 97.20 | 97.20 | 97.20 | ||
| Payables Period | 13.95 | 28.06 | 28.18 | 28.32 | 28.46 | 28.61 | ||
| Receivables Turnover | 3.62 | 3.70 | 3.70 | 3.70 | 3.70 | 3.70 | ||
| Fixed Assets Turnover | 0.61 | 0.61 | 0.62 | 0.63 | 0.63 | 0.66 | ||
| Free Cash Flow/Share | 149.7 | 9.79 | 10.19 | 10.52 | 11.33 | 11.61 |
CHECKPOINT SOFTWARE’s FCF/Share Terminal Value in 2027 was estimated at $165.8, discounted at an interest rate of 7%.
Disclaimer: Nothing in this write-up is financial advice. Gainshore’s founder, partners, and employees may hold long or short positions in Checkpoint Software (CHKP). This article was written by Gainshore and expresses our own opinion. Gainshore has no business relationship with any company whose stock is mentioned in this write-up.
Before making any investment, potential investors should do their own proper due diligence on any name directly or indirectly mentioned in this article. Investors should also consider seeking advice from a broker or financial adviser before making any investment decisions. Any material in this article should be considered general information and not relied on as a formal investment recommendation.
At Gainshore, we analyse thousands of companies, thoroughly screen the best ones and select only the best of the best stocks and ETFs, which we constantly monitor.
We tell you where to invest, and if we are wrong, you get the money back.
With our meticulous and stringent screening analytical process, Gainshore has achieved an extraordinary 100% winning rate on Long Term Stocks, and the Short Term Stocks have repeatedly been beating all global equity markets. Our stock recommendations have grown almost 250% since 2020 while exhibiting minimal negative volatility despite COVID-19, the Ukraine War and the current high inflationary environment.
Discover the Best Investments For 2023 now, or subscribe to our newsletter to learn more.